


TSP Funds: Which is the Top in 2018?
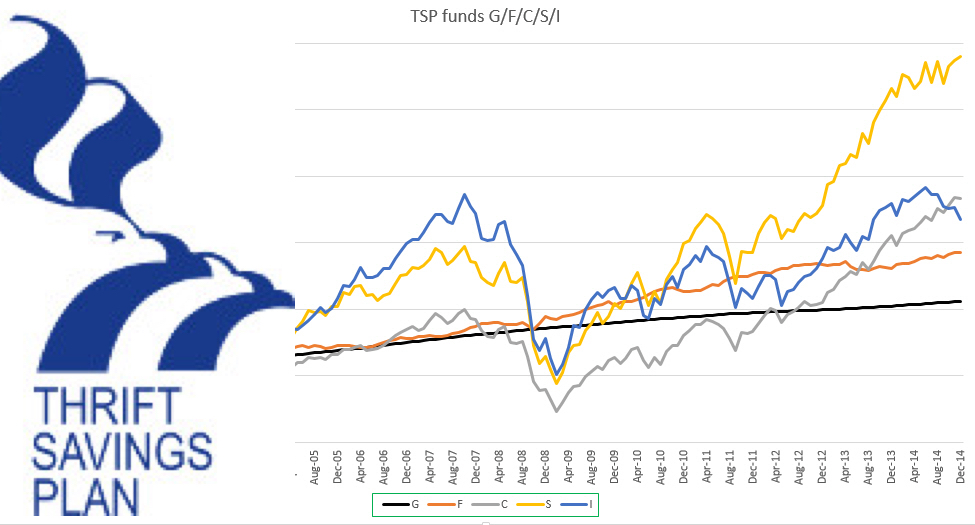
In August, the Dow Jones Industrials (DJIA) went up by 2.2% and the S&P 500 went up by 3%. The C Fund is based on the S&P 500 Index.
Biggest TSP Returns for August
The S Fund was at the top of the list of the TSP funds for August. It had a return of 4.57% The S Fund is also leading all finds for the year-to-date return coming in at 12.84% as well as the best twelve-month return at 23.34%.

Advertisement
Advertisement
Coming in second is the C Fund with a year-to-date return of 9.91% and a 12-month return of 19.63%. In August, the C Fund went up 3.26 percent. This fund is the second most widely held fund in TSP.
Of all the TSP funds, the G Fund has the most assets.
The Safety of the G Fund Does Not Come Free
The G Fund is the most widely held fund in the TSP; it had a return of 0.26 for last month and is up 1.88 percent for 2018. The 1.88 percent is the second last rate of return for all the TSP funds.
Lowest of the TSP return rates in 2018 is the F Fund with a negative return of -0.86 percent.
The G Fund has over the long term, consistently underperformed the TSP stock funds.
TSP Fund Returns for August 2018, Year-to-Date and Last 12 Months
Let us have a look at the latest performance data for all of the TSP funds:
MONTH YTD 12 MONTH
G Fund 0.26% 1.88% 2.66%
F Fund 0.67% -0.86% -0.90%
C Fund 3.26% 9.91% 19.63%
S Fund 4.57% 12.84% 23.34%
I Fund -1.91% -1.95% 4.79%
MONTH YTD 12 MONTH
L Income 0.61% 2.74% 4.99%
L 2020 0.80% 3.30% 6.87%
L 2030 1.28% 4.71% 10.30%
L 2040 1.47% 5.26% 11.77%
L 2050 1.65% 5.77% 13.14%
Average Balance for TSP Participants
Federal workers in the CSRS (Civil Service Retirement System) have the highest average balance in the TSP. Here is a table showing how TSP investors fare based on their retirement system as of July this year.
FERS CSRS Uniformed Service
Total Participants 3,332,206 323,032 1,402,304
Average Balance $143,048 $148,247 $25, 021
No of Roth Participants 501,374 9,937 544,991
Average Roth Balance $12,778 $19,679 $7,730
According to the above data, the number of post-separation withdrawals has steadily increased. The Thrift Saving Plan reports that the totals expected for 2018 are about 12% higher than those in 2017. This goes hand in hand with a retirement report from OPM indicating an increase in the number of TSP participants reaching retirement age.
TSP Transfers in July
Investors in the TSP moved more than $1 billion into the G Fund in July. The S Fund and the Lifecycle Funds both had an uptick in transfers in July; $94,000,000 and $104,000,000 respectively.
Investors transferred $601,000,000 from the C Fund, $567,000,000 from the I Fund, and $79,000,000 from the F Fund.
At the end of July, there was about $568 billion in the TSP plan.